
As a planet, Saturn is perceived as swathed in softly-colored clouds, possibly in bands of an extremely fuzzy definition that surrounds the planet in uniform hooped bands. However, astronomers and astrophysics have been aware of an odd anomaly within these clouds. It exists near the planet’s northern pole and has notably pointed corners, not seen elsewhere on the planet. As there are six of these intersections, the anomaly resembles a hexagon. Despite its remarkable incongruity with the rest of the planet, the shape has been observed reproducibly in papers and reports since the 1980s.
The Saturnian Hexagon
Saturn has an apical angle (which means its equator tilts towards or away from the sun as it spins around it) of just over 26 degrees. Therefore, it is relatively easy for scientists on Earth to observe and quantify its poles using telescopy. As a result, hints of the hexagonal anomaly have been available for some time.
However, it was not until the Voyager mission that its presence (and shape) was confirmed. A series of papers published in the late 80s used various types of imaging and spectroscopy to visualize the hexagon, which was apparent at the 86th latitude from the pole.
These studies also determined that the hexagonal shape was likely to be associated with a ‘hotspot’ at those latitudes of the northern Saturnian hemisphere. Therefore, it was also possible that the angular phenomenon occurred during the planet’s summer.
Further work also helped demonstrate that the hexagon was also a vortex or a weather system of a kind. This theory also increased the probability that it could be a Rossby wave, which is a structure with distinct jet-stream that circulates around a planet’s pole due to the forces and other physicochemical attributes acting on the region. For example, the poles of the Earth also have Rossby waves. However, they are not so regularly shaped as the Saturnian North Polar Vortex (SNPV).
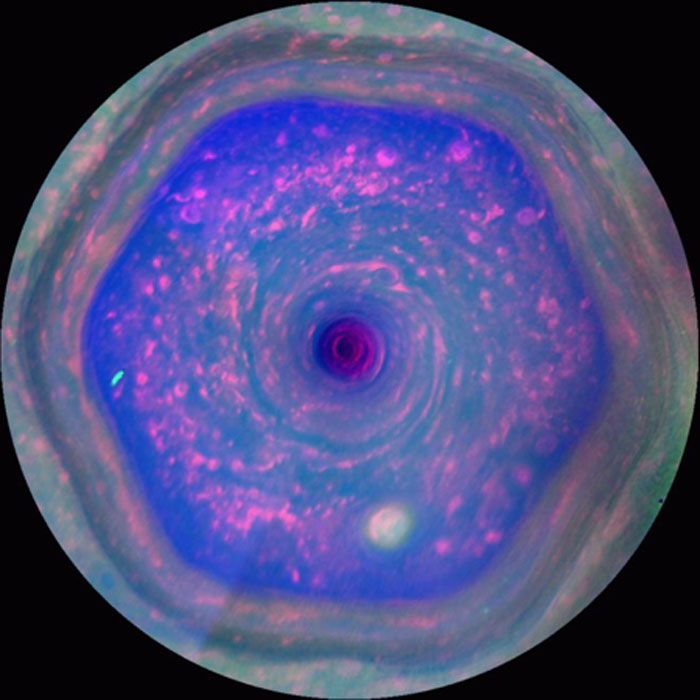
An image of the SNPV generated from data captured by Cassini. (Source: NASA/JPL-Caltech/SSI/Hampton University)
Cassini and the SNPV
This may have been one of the factors in scheduling the launch and duration of Cassini’s voyage to the planet. Saturnian years are long (equivalent to about 30 years on Earth), and their winters are extreme in terms of weather and temperature (e.g., temperatures can reach -158 degrees Celsius). These conditions would have been far too severe for the infrared (IR) spectrometer (or CIRS) mounted on Cassini. Therefore, the spacecraft was sent to Saturn in 2004 during spring on the planet. This could enable it to keep CIRS functioning, and also to capture more images and data on the northern pole and its vortex.
When the SNPV was first described, it was found to be a part of the troposphere (or lower atmosphere) above the pole. However, subsequent reports indicated that there were analogous signs of a hexagon in the stratosphere (upper atmosphere) as well.
These observations were determined through the analysis of the IR data sent back from Voyager, which captured the IR brightness emanating from the particle types that make up the ‘clouds’ above the pole’s surface. The particles were found to be hydrocarbons such as ethane. Their brightness (which relate to IR wavelengths in the 0- 20µm range) was taken as an indicator of the temperatures to which they are subject.
This spectrum has been used to generate high-quality images of the SNPV in the past. This body of data has also been used to demonstrate that the NPSV gradually forms in response to rising temperatures during the summer, then dissipates again as the pole cools down when it moves into winter.
Cassini also recorded this type of data, as well as that on pressure and wind velocity, while it was trained on the NSPV. The data suggests that the vessel witnessed a formation of the vortex, which took nearly three Earth years (from 2014 until 2017) to form.
The analysis of this event has finally been published and is now available in the journal Nature Communications. This paper re-affirms that the hexagonal feature is indeed present in the planet’s stratosphere, and not just in the troposphere, as once thought.
The team behind it used the Michelson interferometry component of the overall CIRS (which gives mid-IR values) and processed this data using an optimal estimation retrieval algorithm. This technique expressed the temperatures at the troposphere (which experiences pressures in the region of 80 to 300 millibars or mbar), stratosphere (0.5-5mbar) and cloud tops (approximately 600mbar) over time.
The SNPV: Now in Color!
This data enabled the scientists to compose a colorimetric ‘brightness map’ of the north polar region. Again, this brightness was measured through the temperatures associated with the ethane (and acetylene) content of the atmosphere, and they showed the formation of a distinctly hexagonal vortex over the three years of data.
The team reported that this iteration of the NPSV started at approximately 87 degrees north of the pole and had a distinct boundary near 78 degrees north.
The scientists also reported that there was not enough evidence to support that the hexagon originated from the troposphere (most notably a necessary temperature gradient in this region over time) and was instead related to the interface between this part of the atmosphere and the stratosphere (the tropopause, associated with 80 to 100mbar) at the lowest.
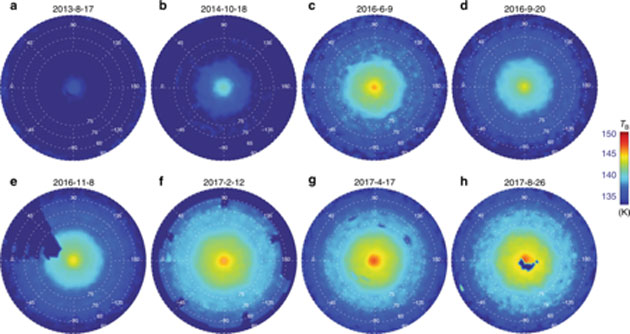
Brightness maps track the formation of the SNPV, showing its distinctive shape, from 2013 to 2017. Dark blue areas indicate missing data. (Source: L. N. Fletcher et al, 2018)
In addition, the researchers reported that overall temperatures at the pole increased by 10 degrees Kelvin (K) over this time-frame.
The scientists conceded that, despite these findings, they were not much closer to a conclusive theory of why or how the NPSV forms every summer. Earlier attempts suggested that wind shear acting on the hydrocarbon clouds could be responsible. However, Cassini’s data indicated that the north pole actually experiences negative wind shear as spring moves into summer. Furthermore, any wind shear observed during the mission failed to modify the periodographic wave of the vortex. In addition, a strong, 120-meter-per-second polar jet, a common feature of the north pole at 78 degrees, also failed to disrupt the vertices of the hexagon.
Why a Hexagon?
On the other hand, the team did detect a distinct band of positive wind shear at 5mbar and 83 degrees north, which persisted until 2017. Perhaps this factor had a role to play in the formation of the NPSV.
Nevertheless, the team concluded that the vortex was most likely to be a Rossby wave, influenced by steadily rising temperatures within atmospheric hydrocarbons (dominated by ethane and acetylene, which are natural coolants).
Therefore, the most concrete thesis is that the hexagon is formed by strong polar jets of wind, or rather, by a marked instability in the easternmost of these. In other words, the jet stream that makes up the hexagon is ‘dragged’ into its angular shape by this anomaly. The rest of the jets is believed to form a waveguide that propagates the hexagon’s shape as the wave rushes around the pole.
So, despite Cassini’s data-gathering and recording, there is still much about Saturn we do not know. But we have now conclusively proven the existence of the NPSV and tracked it from its formation to the start of its dissipation. Cassini was also the first entity to observe such a vortex since 1989, which is only one Saturnian year ago now.
Considering the upcoming missions, and the continuing scope for discovery in the remainder of Cassini’s telemetry, it is fascinating to imagine what we will know by the time another year passes on the ringed planet.
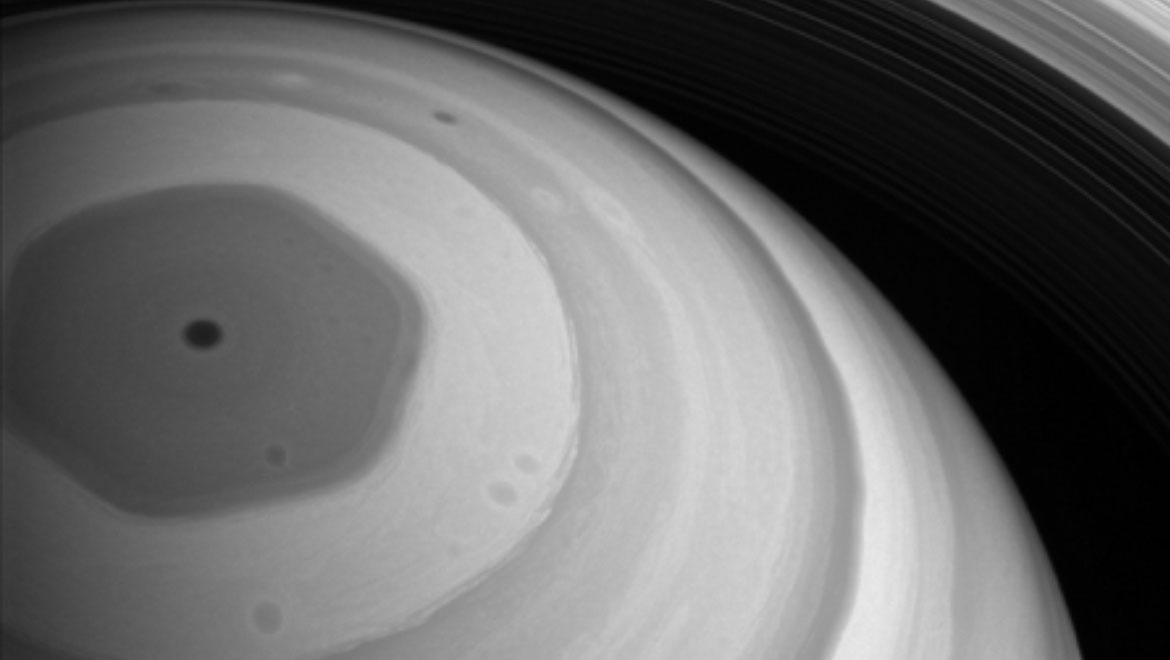
Top Image: Cassini gathered data on the Saturnian hexagon during the planet’s summer solstice, when the north pole was tilted towards the sun. (Source: NASA/JPL-Caltech/Space Science Institute)
References
Saturn Sprouts Another Weird Hexagon, Puzzling Scientists, 2018, LiveScience, https://www.livescience.com/63497-saturn-high-altitude-hexagon-vortex.html , (accessed 9 September 2018)
L. N. Fletcher, et al. (2018) A hexagon in Saturn’s northern stratosphere surrounding the emerging summertime polar vortex. Nature Communications. 9:(1). pp.3564.
D. Y. Gezari, et al. (1989) New features in Saturn’s atmosphere revealed by high-resolution thermal infrared images. Nature. 342: pp.777.
D. A. Godfrey. (1988) A hexagonal feature around Saturn's north pole. Icarus. 76:(2). pp.335-356.
P. G. J. Irwin, et al. (2008) The NEMESIS planetary atmosphere radiative transfer and retrieval tool. Journal of Quantitative Spectroscopy and Radiative Transfer. 109:(6). pp.1136-1150.
A. Sánchez-Lavega, et al. (2014) The long-term steady motion of Saturn's hexagon and the stability of its enclosed jet stream under seasonal changes. Geophysical Research Letters. 41:(5). pp.1425-1431.


No comment