
Fingerprint studies, predicted by climatic models, use pattern information to separate human and natural influences on the climate. Most fingerprint research relies on patterns of climate change that are averaged out over decades.
The average of the latest satellite dataset versions (RSS v4.0, STAR v4.0, and UAH v6.0) has a warming trend of 0.181 °C/decade over the 456-month period from January 1979 to December 2016. A recent focus on satellite temperature data in political discourse has provided an opportunity to highlight this fingerprint evidence and underscore the importance of continued satellite-based monitoring of the Earth’s climate.
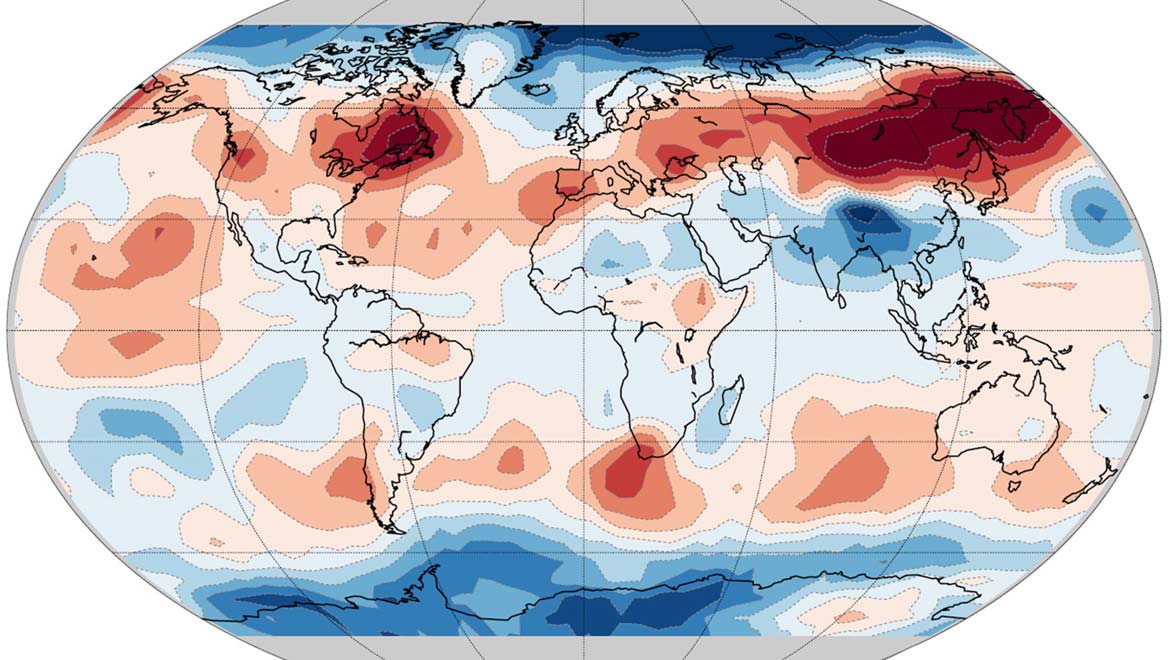
The warming of the climatic system is indisputable - the atmosphere and the oceans have warmed, the amounts of snow and ice have diminished with rising sea levels, anthropogenic greenhouse gas emissions have increased since the pre-industrial era, driven largely by economic and population growth. This increase has led to large atmospheric concentrations of carbon dioxide, methane and nitrous oxide that were previously unprecedented in the last 800,000 years. The effects of gases, together with other anthropogenic drivers, have been detected around the world, and are extremely likely to be the dominant cause of the observed warming since the mid-20th century.
Human-induced global warming. (Source: IPCC)
Now, climate scientists have established that human-induced activities are pushing seasonal temperatures out of balance. The concept of human-triggered seasonal change is well-backed by researchers as they have attributed a “roughly 5 in 1 million” chance of these changes to be caused naturally.
Reasoning behind Human Influence on Seasonal Change
Some scientific evidence, which suggests that the change in seasonal cycles are human-induced could be:
• Changes by external forcing - There are scientific signals for seasonal changes due to human-caused external forcing like stratospheric ozone depletion and particulate pollution
• Climate variability - Human activities have shown marked changes in local weather and seasonality due to climate variations and their feedback
• Biodiversity changes - There are many signals of seasonal changes in the distributions and abundance of floral and faunal species along with the ecosystems.
These physio-biological signs have led to the scientific justification that the changes are partly mediated by seasonal climate change arising from global warming and that the fingerprint studies are a helpful approach to understanding this phenomenon.
Understanding Fingerprint Analysis for Studying Season Change
According to the study conducted by a climate researcher, Benjamin D. Santer, at the Lawrence Liverore National Laboratory, the Earth’s climate is affected by different external factors (like natural changes in solar irradiance and increase in carbon emissions caused by man) and internal influences (e.g., a wide range of quasi-periodic natural cycles such as Interdecadal Pacific Oscillation [IPO]).
To estimate the quantification of human and natural influences on the seasons, the researchers differentiated the climate signals of multiple external factors from the noise of internal natural change quotients.
Since each factor that affects the climate in unique ways, the separation of these signals and the noise were done on the basis of respective signatures assigned to a particular mode of variability and external influence. These signatures were then analyzed in spatiotemporal patterns called "fingerprints."
Fingerprint analyses are ground-breaking techniques in climate studies as they give a much clearer view than global average studies. Fingerprints used in attribution assessments are grounded in physics. It is clear and has been observed that greenhouse gas-increases have reduced the efficiency with which the Earth can radiate heat from the surface to space, which should increase global surface temperature. This warming effect is expected to take time to manifest itself since widespread warming of the ocean surface layers takes years and warming of the deep ocean takes centuries.
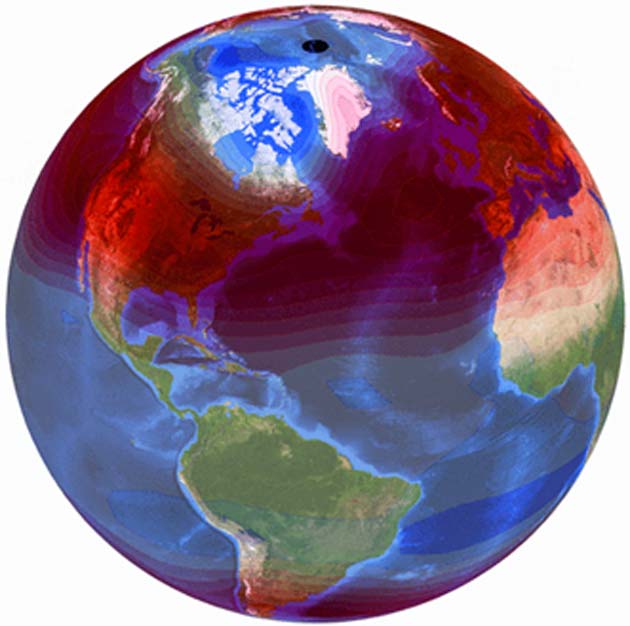
Trends in the amplitude of the annual cycle of tropospheric temperature. (Source: Santer et al., 2018)
Fingerprints via Tropospheric Temperatures
Formal fingerprint studies performed with the amplitude of the annual cycle of tropospheric temperature is a new concept.
The troposphere is the lowest layer of Earth's atmosphere. Most of the mass (about 75-80%) of the atmosphere is in the troposphere. Many types of clouds are found in the troposphere, and almost all weather occurs within this layer. This layer extends upward to about 10 km (6.2 miles or about 33,000 feet) above sea level. The height of the top of the troposphere varies with latitude (it is lowest over the poles and highest at the equator) and by season, where it is lower in winter and higher in summer. The troposphere can be as high as 20 km (12 miles or 65,000 feet) near the equator, and as low as 7 km (4 miles or 23,000 feet) over the poles in winter.
Increase in greenhouse gases in the troposphere generally acts as an insulator, leading to warming. In contrast, the stratosphere, which is the next layer, is cooled due to a combination of less warmth leaving the troposphere and the depletion of the ozone layer. Changes in the troposphere have the potential to change global weather patterns, while a cooler stratosphere lets in harmful ultraviolet radiation and can affect the troposphere, especially in the polar regions.
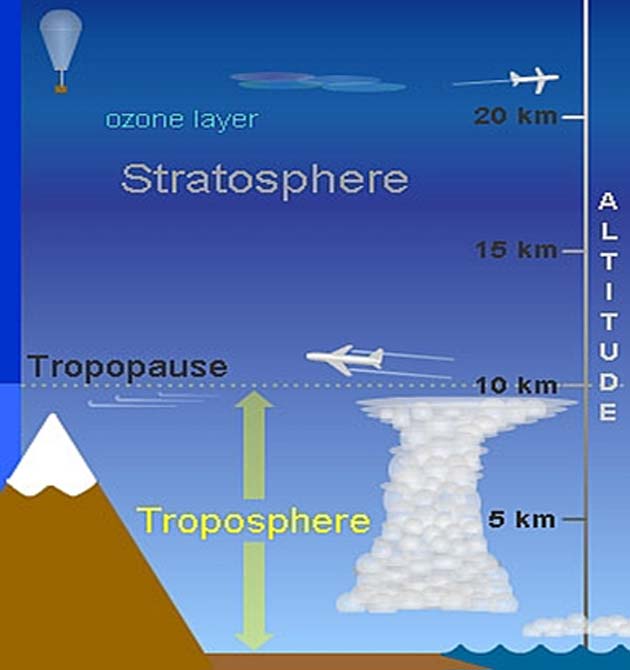
Troposphere. (Source: UCAR)
Unlike surface temperature datasets, satellite measurements of tropospheric temperature have near-global coverage and no gaps in time. This is advantageous for fingerprint studies. Detection methods generally require an estimate of the true but unknown climate-change signal in response to an individual forcing or a set of forcing.
The recent study published in July 2018 by Santer and his team suggests that for tropospheric temperature, a human-caused signal is now evident. Such confirmation open up new avenues for further attribution studies.
The future point to emphasize and which needs to be taken care of is the gap between climate analytics and policymaking.
Satellite temperature measurements do not support the recent claim of a “leveling off of warming” over the past two decades. According to Santer, incorrect claims are important to address and rectify them for correct and efficient mitigation, and adaptation strategies like carbon tax-bill.
After all, if we don't appreciate the reasons by which our species existed on this planet, how will we appreciate the future we are headed towards?
Top Image: Satellite-measured seasonal temperature cycle (red indicates larger temperature swing, blue indicates smaller temperature swing). (Source: Santer et al., 2018)
References
Santer et al., (2018) Humans influence on the seasonal cycle of tropospheric temperature, Science, 361
Santer et al., (2017) Tropospheric warming over the past two decades, Scientific Reports, 7
Hegerl et al., (2011) Patterns of change: whose fingerprint is seen in global warming? Environmental Research Letters, 6 (4)


No comment